Download our free SNMP White Paper. Featuring SNMP Expert Marshall DenHartog.
This guidebook has been created to give you the information you need to successfully implement SNMP-based alarm monitoring in your network.
1-800-693-0351
Have a specific question? Ask our team of expert engineers and get a specific answer!
Sign up for the next DPS Factory Training!
Whether you're new to our equipment or you've used it for years, DPS factory training is the best way to get more from your monitoring.
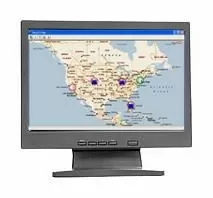
Reserve Your Seat TodayA map is a helpful tool that allows you to see an overall layout of a city or state. It also allows you to pinpoint a specific destination. A graphical display map for your network has the same functionality - allowing you to see the layout of your network and pinpoint exact problem areas, all the way down to the server. This is typically referred to as a GUI or Graphical User Interface. It allows the user to see valuable alarm information quickly, in an easy to understand format. If you have an SNMP master, a GUI is a great way to take the information from your RTUs and represent it in a visual way.
A graphical display presents information in context more immediately than a text-based display. When we see a picture, its meaning and implications register much more quickly than if the information must be read. Research has shown that graphics displays present information more quickly and understandably, especially if multiple types of data need to be presented.
Events in your network can be mapped to a graphic display showing a physical map of all your network locations. System operators can immediately see which sites and which areas of your network have alarms. Multi-layer graphics let the user to zoom down to site, rack, device, and alarm point level to examine the precise location and nature of the problem.
A GUI can have many benefits that improve visibility of your site.
When looking for an SNMP map or GUI for your network, make sure that it has detailed descriptions and clear, user-friendly maps. Some GUIs also offer other features, such as:
These additional features are not standard on all master GUIs, but if you purchase a master GUI that has at least some of these features, it will make a world of difference in your monitoring capabilities. Being able to log trends and make easy changes to settings will help you have complete and immediate control over what happens in your network. These features will not only improve visibility, but will also allow you to react to issues quicker than you normally would be able to.
The T/MON GFX GUI interface is the easiest way to get an overall view of your network and devices. T/MonGFX is the next evolution of the T/Mon graphical interface. It allows you to view alarms visually on layered geographic maps. This multiple layer support enables your staff to drill down from regions, to cities, to sites, to photographs of individual equipment racks. This provides a "war room" view of your alarms right down to the network devices themselves, rapidly accelerating repair operations.
The GFX features a layout that is easy to read and understand and is similar to Window's layout. T/Mon GFX includes built-in support for two simultaneous users, with the option to add many more as networks expand. T/Mon GFX runs on any standard Windows workstation, but all core monitoring operations are handled by the ultra-reliable T/Mon platform. When this reliability is combined with enhanced security, T/Mon users can be sure that their mission-critical alarm monitoring will perform when it's needed most.
T/MonGFX runs on any standard Windows workstation, but all core monitoring operations are handled by the ultra-reliable T/Mon platform. The rapid processing time enables T/MonGFX to keep speed with the very fast T/Mon. T/MonGFX supports Windows MapPoint and many common Windows controls.
The T/MON GFX makes your life easier. You will no longer have to aimlessly send techs to different sites or racks just to find out where the problem is. With the T/MON GFX you'll not only know where the problem is, but also what the problem is so that you can ensure your tech arrives at the site with everything he needs to fix the problem quickly. The T/MON GFX will save you windshield time, money and frustration. You can't afford to have limited visibility of your site. Make sure you are the first to know exactly what is happening at all of your sites.