Download our free Monitoring Fundamentals Tutorial.
An introduction to Monitoring Fundamentals strictly from the perspective of telecom network alarm management.
1-800-693-0351
Have a specific question? Ask our team of expert engineers and get a specific answer!
Sign up for the next DPS Factory Training!

Whether you're new to our equipment or you've used it for years, DPS factory training is the best way to get more from your monitoring.
Reserve Your Seat TodayAt DPS, we strive to make sure you get the right type of "Network monitoring" information that you need to make informed decisions. We make sure that the information is presented in the format that makes the most sense for your particular needs at the given time.
If you're looking for education, we provide data rich White Papers. If you want to take a quick look at solutions, you can browse our product pages. Screen shots with functional summaries provide the next level of detail. Of course there are downloadable product summaries (and user manuals) for the engineers. Our web site also contains application and product slide show presentations that you can flip through at your convenience. Video interviews, located on our product pages, let you find out just what our client think about our products and us. If you're the type that likes to have your questions and monitoring applications quickly addressed by a live "knowledgeable person" or would like to have a guided web based presentation you can call our sales engineers. Finally The Protocol Newsletter keeps you up to date with new innovations, monitoring applications and provides details about how our clients are using our products to enhance their operations.
Having done all this, we asked ourselves, "What did we miss? Who isn't getting their questions answered in the most impactful way?" The answer was to provide "hands on" experience through interactive simulations of how our solutions "feel". These simulations provide insight into the various core concepts of the application as well as how the interface works. The net result is you get answers quickly and at your convenience.

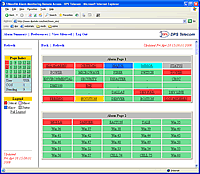
The first of our web simulation tools is for the T/Mon alarm monitoring system. While T/Mon has a few different types of user interfaces, one of the most widely used is its web interface because of its convenience and platform independence (Start simulation). The simulation starts you out at the alarm summary page which illustrates how you can categorize alarm by severity, types of equipment, location etc. You will see a series of colored boxes (that indicate severity) as well as blinking text to show you what has changed. Clicking on one of the boxes (All Alarms for example) will take you to an alarm detail screen that shows you the specifics of all the alarms that have failed and that belong to the category you clicked. From there, clicking on the "View COS" command will show you all the alarms that recently changed in your system (which by the way can all be alarms that cleared). Pressing the "ACK" button will acknowledge the alarm. Another key benefit is that the T/Mon has an HTTPS option for those who want to securely access their system from outside the company intranet.

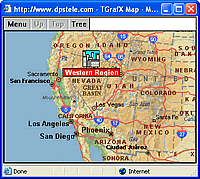
T/GrafX offers a Graphical User Interface to the T/Mon alarm monitoring system (Start simulation). Please note, since this is a web simulation you will not have all the functionality and control (i.e.: right click sub menus and other links will not function), but you will have the opportunity to experience first hand, how you can drill down through various map levels (just keep clicking on the icon with the flashing red label). Ultimately you will get to the lowest level screen showing you the building floor plan. With T/GrafX you can use your own bitmap graphics to further configure your display. You can click on the "Tree" button to show you a hierarchy table that you would normally use to take shortcuts direct to any part of your network. The "Top" button will take you back to the highest-level view.
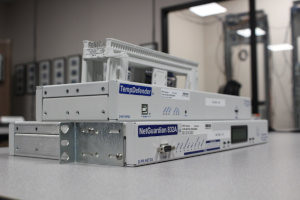
One of our most popular remotes is the NetGuardian832 series. The feature that makes it stand out from your typical remote is its Web Browser interface (Start simulation). Once you start the simulation, you will see a logon screen (disabled in this demo, simply click submit). The alarm summary screen tells you how many alarms you have in various categories. Clicking on any one will show you detailed descriptions of the alarms and provide color-coded state indication (Alarm and Clear). You can also click on the links under the "Monitor" button on the left side of the screen to: View your analog values, see event log, issue controls, or even select the site cam viewing option. Pressing the green "Edit" button on the lower left side of the screen explodes the Edit menu and now you can click the various links to see a variety of configuration screens. The NetGuardian also comes standard with NGEDIT, a Windows based configuration utility.
If you haven't already experienced any of the simulations yet, give them a try.
T/Mon Web Interface Simulation
T/GrafX Web Interface Simulation
NetGuardian Web Interface Simulation